Table of Contents
- SNAP Funding Crisis Explained
- Trump’s Claim Under Scrutiny
- Who Really Relies on SNAP?
- Rural America and SNAP
- Sources
SNAP Funding Crisis Explained
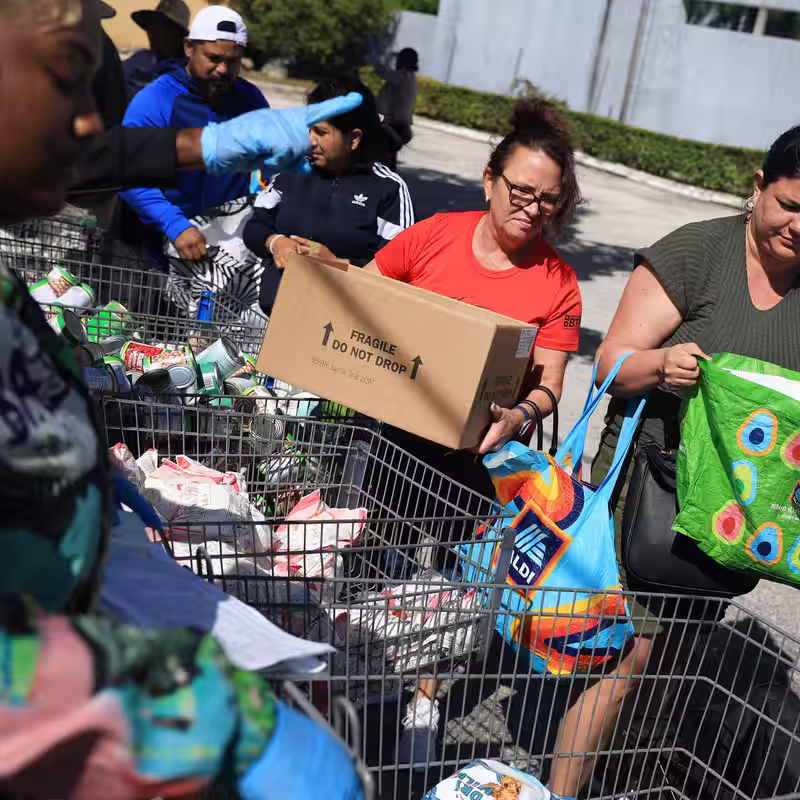
As the U.S. government shutdown enters its second month, millions of Americans face uncertainty over their food assistance. The Supplemental Nutrition Assistance Program (SNAP)—commonly known as food stamps—was set to lose federal funding on November 1, 2025, putting roughly 42 million people at risk.
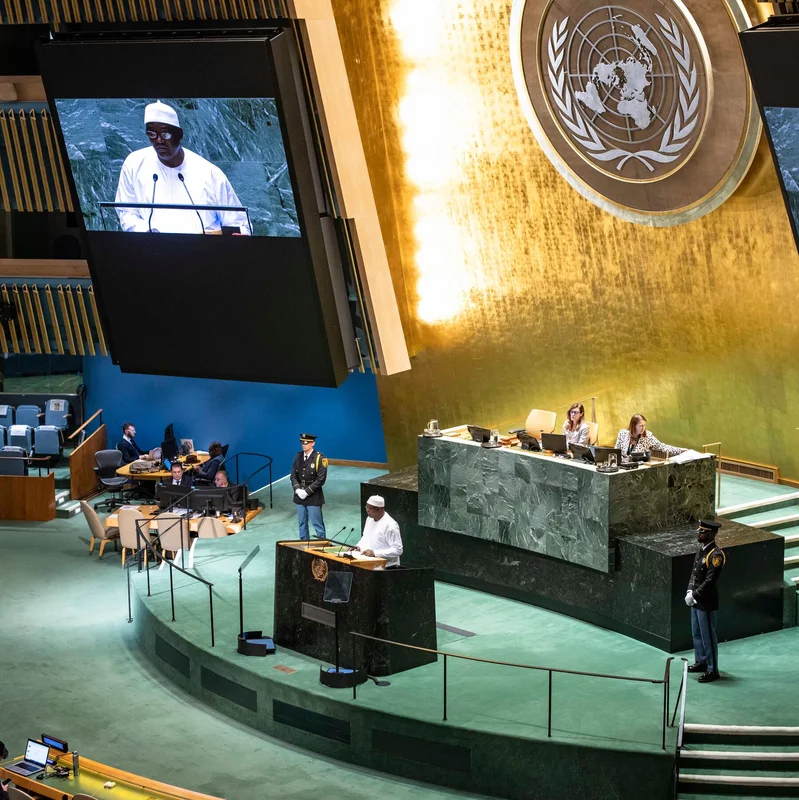
Although a federal judge ordered the Trump administration to continue SNAP payments during the shutdown, logistical delays mean benefits for November could be late. President Trump acknowledged the issue but placed blame squarely on Democrats, claiming the disruption would “largely” hurt their own voters.
Trump’s Claim Under Scrutiny
“Largely, when you talk about SNAP, you’re talking about largely Democrats,” Trump told reporters returning from Asia. “They’re hurting their own people.”
But data tells a more complex story. While Democratic-led districts do have higher average SNAP participation rates, millions of recipients live in Republican-held areas—especially in rural counties that overwhelmingly supported Trump in past elections.
SNAP by the Numbers
| Region Type | Average SNAP Participation Rate |
|---|---|
| Democratic-controlled states | 12.5% |
| Republican-controlled states | 10.5% |
| Split-control states | 11.7% |
In total, Democrats represent about 8.5 million SNAP households, while Republicans represent over 7 million—a significant share that contradicts the idea that SNAP is “largely” a Democratic issue.
Who Really Relies on SNAP?
According to the latest USDA data from 2023:
- Of the 100 congressional districts with the highest SNAP usage, 73 are represented by Democrats—but 27 are Republican-held.
- In solidly Democratic districts (Cook PVI ≥ +10), 15% of households receive SNAP.
- In solidly Republican districts (Cook PVI ≤ -10), that figure is still 11%.
A 2012 Pew Research Center survey found that 22% of Democrats reported receiving food stamps at some point, compared to 10% of Republicans. However, when asked about ideology instead of party affiliation, both liberals and conservatives reported nearly identical rates (17%) of SNAP use.
Rural America and SNAP
One often-overlooked fact: rural communities—many of which voted heavily for Trump—are especially dependent on SNAP. According to the Food Research & Action Center, 1 in 7 rural households
A 2024 analysis by Political Explorer revealed that more than 2,000 U.S. counties saw rising SNAP enrollment between 2010 and 2020. Donald Trump won nearly 80% of those counties
“I have no doubt that the cuts will affect Republican voters,” said Christopher Bosso, professor of food policy at Northeastern University and author of a book on SNAP history.